Pivot mtf semaphore support&resistance [LM]Hello Traders,
I would like to introduce you pivot semaphore mtf support&resistance levels. The idea is the same as my other S/R scripts to have a look at the important levels. The Semaphore is used to spot future multi-level Supports and Resistance zones. It is also useful to spot HL or LL or HH or LH zones. The script is based on amazing work of @LucF so really big thanks for your work on mtf line offsetting.
It has three settings:
First two settings are for higher timeframes
Third setting is setting for pivots on current timeframe
!!!! Very important is there is limitation in pinescript how many candles you can look back(4999) if you choose timeframes that are very distant from each other there is a chance that those lines won't show up
Hopefully you will enjoy
Cheers, Lukas
"support resistance" için komut dosyalarını ara

zigzag support&resistance multi timeframe levels [LM]Hello Traders,
I would like to introduce you zigzag support&resistance multi timeframe levels. It is based on the ZigZag semafor script made by DevLucem so shout out to him
The Semafor is used to spot future multi-level Supports and Resistance zones.
It is also useful to spot HL or LL or HH or LH zones at different Depth settings.
I's the same zigzag indicator as my other zigzag indicator with distinction that supports multi timeframe levels as well, with depth setting for every timeframe.
I hope you will enjoy it as I enjoyed to write it.
Lukas

Bollinger bands volume support&resistance multi timeframe [LM]Hello traders,
I would like to introduce you Bollinger bands volume support&resistance multi timeframe script. The benchmark is the Upper Bollinger Band applied on volume with a look-back setting of 233 and a displacement of 3 standard deviations.
(There’s nothing magical about the setting of 233, but you should use a long-term parameter so that you get a stable Bollinger Band. Short-term parameters tend to produce erratic bands.)
If a price bar shows volume that exceeds this benchmark, we will zoom in and use it as potential support or resistance area in our price analysis. if there is only one candle that will crossover and cross under than only high and lo of that candle is counting. If there are more consecutive bars that are above upper bollinger band than the range high and lo is calculated from high and lows of that candle
As you can see on the image high and low is only rendered when volume crossover and cross under bollinger bands
I hope you will enjoy it

Volatility semaphore Support&Resistance multi timeframe [LM]Hello Traders,
I would like to introduce you volatility semaphore support&resistance levels. The idea is the same as the pivot
semaphore script of mine to spot the importance of support&resistence.
It is little bit different than previous script as it uses different line API than previous volatility support& resistance multi timeframe . You have more control over hat and how many lines are rendered(better to use odd numbers in line count setting as it always finds 2 S/R lines). Also this indicator has setup for contol whether you want wicky candles or no by setting percentage of candle body that is accepted.
I hope you will enjoy it.

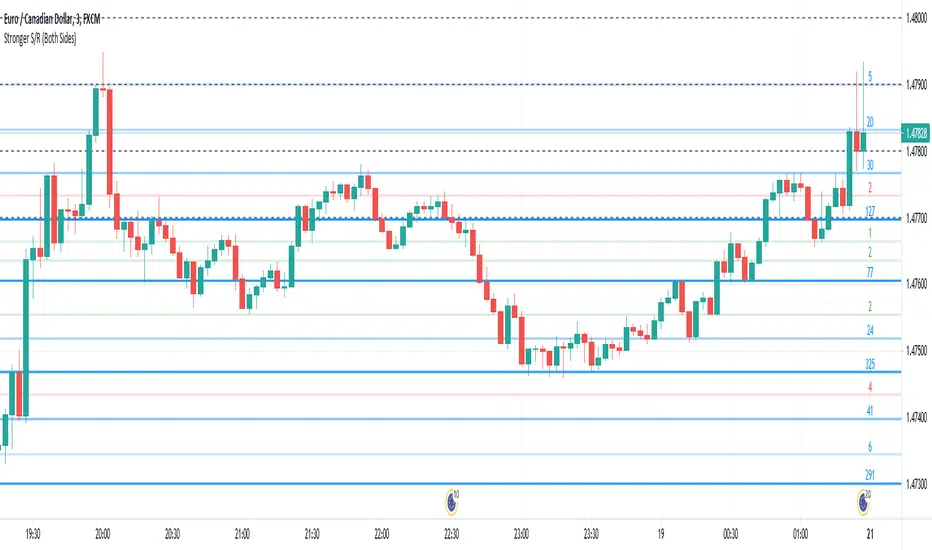
Stronger Classical Support/Resistance + Round LevelsI wrote some Support/Resistance scripts before this. In this new script, I implemented the logic of the code from the scratch, so it's very different from my previous S/R indicators and I think it's more advanced, accurate and efficient.
As the result it could do the followings for now:
- Draw more strong classical resistance/support levels by checking previous direction changes of the chart as far as Pine technically allows
- Colorize the levels based on the counted points of retracement/pullback (The darker the color is, the stronger the level is.)
- Show the number of reactions to each level
- Change the color of each level based on its main role as support, resistance or both
- Draw close round levels to current price for Forex pairs
I suggest all users of my previous S/R indicators to try this one.
Feel free to send me any issue or opinion!
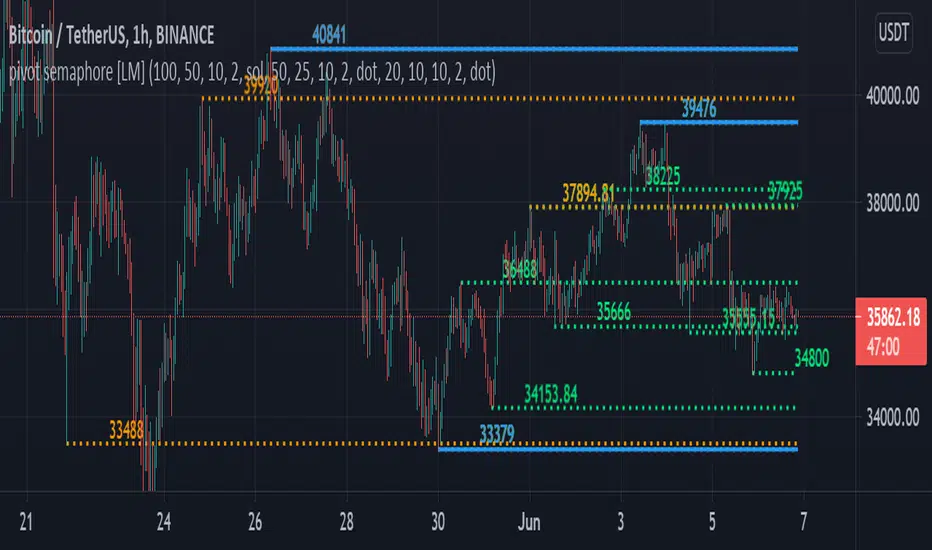
pivot semaphore support&resistance levels [LM]Hello Traders,
I would like to introduce you pivot semaphore support&resistance levels. The idea is the same as the zigzag script of mine to spot the importance of support&resistence
The Semafor is used to spot future multi-level Supports and Resistance zones.
It is also useful to spot HL or LL or HH or LH zones at different Depth settings.
The red zones are the extreme places where the market has a higher chance of reversing while the green zones have the lowest setting with lower chances of the market reversal
The lines can be extended like so
The lines also can just stop extending when price will reach it
Enjoy!
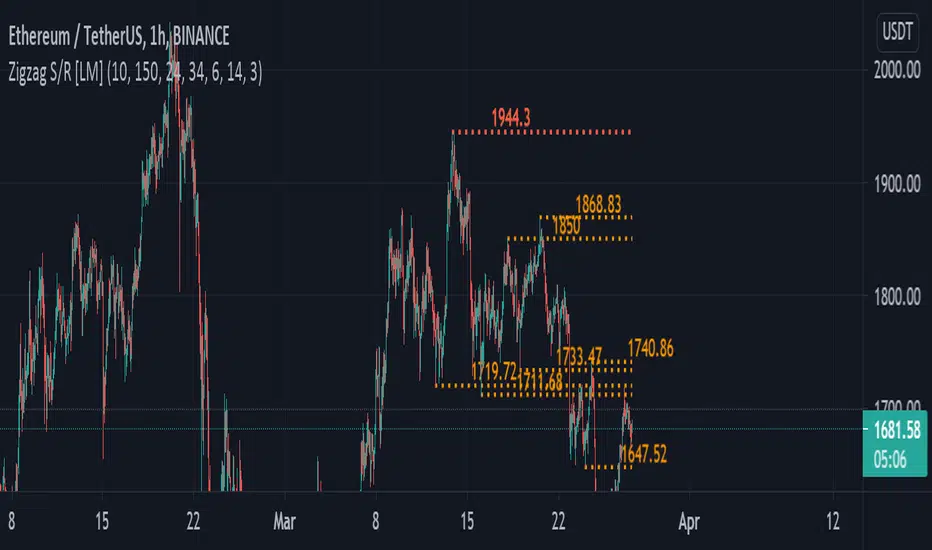
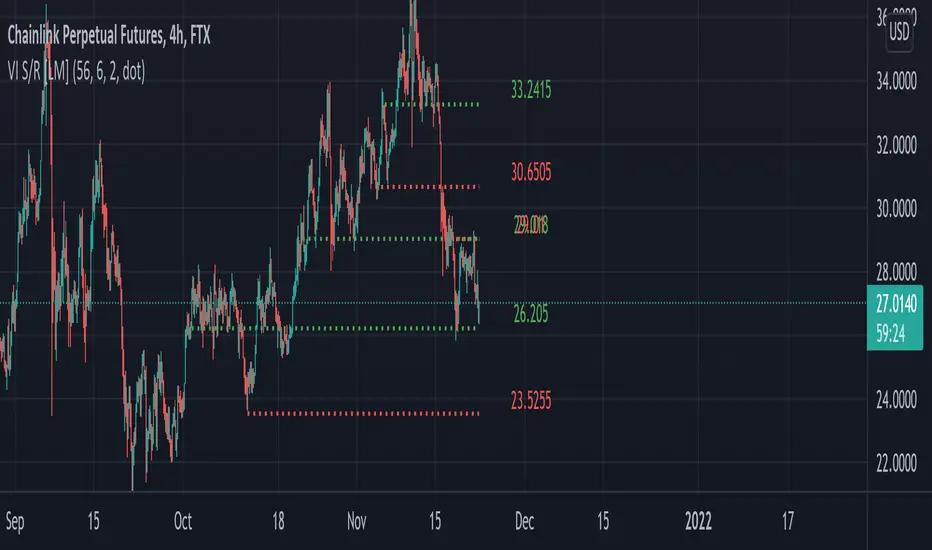
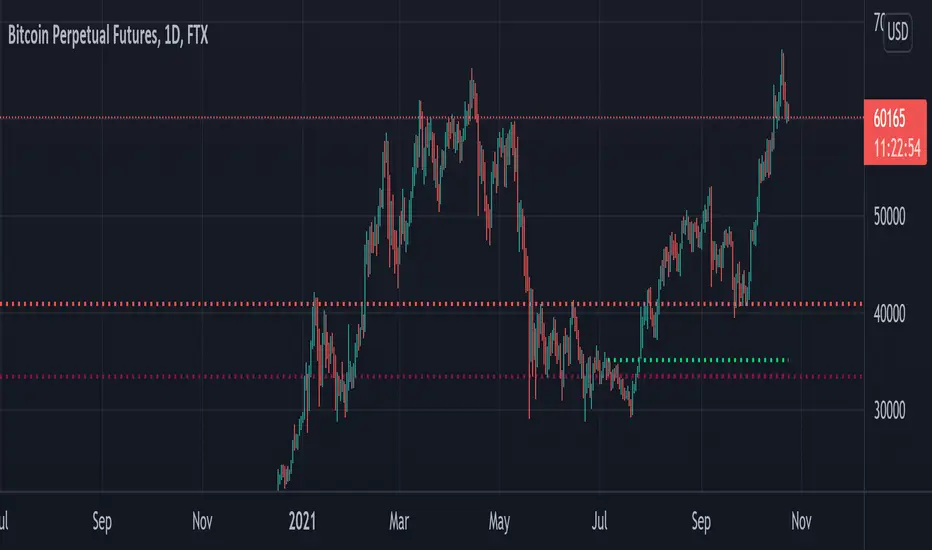
zigzag support&resistance levels [LM]Hello Traders,
I would like to introduce you zigzag support&resistance levels. It is based on the ZigZag semafor script made by DevLucem so shout out to him
The Semafor is used to spot future multi-level Supports and Resistance zones.
It is also useful to spot HL or LL or HH or LH zones at different Depth settings.
The red zones are the extreme places where the market has a higher chance of reversing while the green zones have the lowest setting with lower chances of the market reversal
I have refactored script and extended it with the horizontals.
The lines can be extended like so if you want to see
The lines also can expire when the price will reach it you can change this in general settings:
Also you can use view from the original script with just label circles
Enjoy!
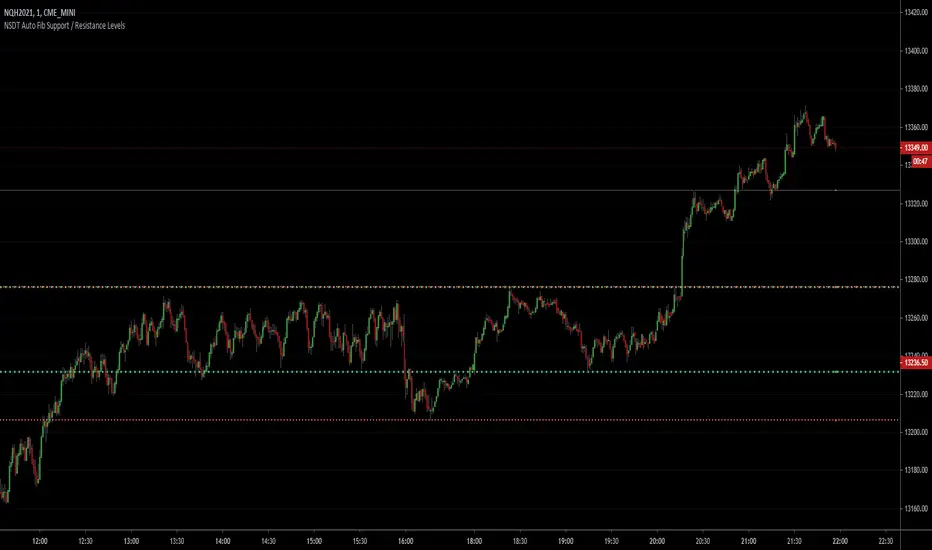
NSDT Auto Fib Support / Resistance LevelsThis script automatically plots support and resistance lines using the fib numbers as the amount of candles to lookback. Each line is colored differently to easily identify the support/resistance pair (i.e. 23%, 38%, 61%, etc..) with the 50% (Green) and 78% (Red) a thicker line. All variables are editable. Added alert capability.
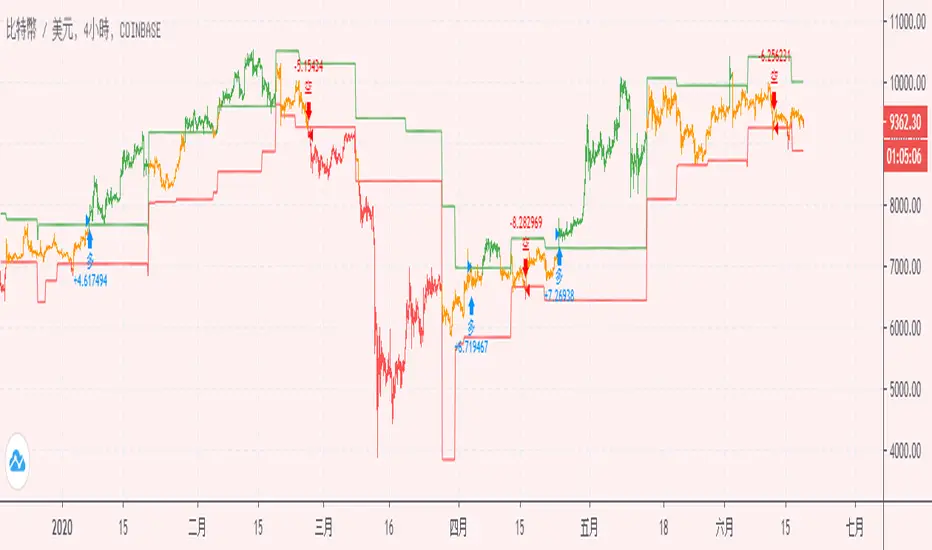
[LunaOwl] Support Resistance Strategy V4作品: 支撐壓力策略
A simple Support Resistance Breakthrough Strategy, the only difference is that it is PineScript @version=4. interested parties can use it as a reference.
Its logic is simple, wish your all the best.
一個簡單的支撐阻力突破策略,唯一的差異,在於它是PineScript第四版。有興趣的可以拿來當作參考,簡易的指標。祝你們順心。
Support level refers to the support price that the exchange rate may encounter when it falls, so as to stop falling and stabilize the price.
The corresponding concept is the resistance level, that is, the pressure that the exchange rate may encounter when it rises, thus reversing to a falling price.
支撐位是指匯價在下跌時可能遇到的支撐價格,從而止跌回穩的價格,對應的概念是阻力位,也即匯價上漲時可能遇到的壓力,從而反轉為下跌的價格。
Iconik Trading Suite: Auto Support/Resistance - WeeklyAutogeneration of support and resistance lines. Posts a horizontal line of the open/close for the past 40 weekly candles.
DM for a PowerPoint describing this indicator and the rest of Iconik in detail.
Iconik Trading Suite Indicator List:
ITS-OSC: Oscillators (v2)
ITS-PAA: Price Action Alerts (v2)
ITS-ASR: Auto Support/Resistance
-> Daily (v2)
-> 3 Day (v2)
-> Weekly (v2)
ITS-4TFC: 4 Time Frame Confirmation (v1)
ITS-DIV: Divergence Seeker (v1)

Iconik Trading Suite: Auto Support/Resistance - 3 DayAutogeneration of support and resistance lines. Posts a horizontal line of the open/close for the past 40 3 Day candles.
DM for a PowerPoint describing this indicator and the rest of Iconik in detail.
Iconik Trading Suite Indicator List:
ITS-OSC: Oscillators (v2)
ITS-PAA: Price Action Alerts (v2)
ITS-ASR: Auto Support/Resistance
-> Daily (v2)
-> 3 Day (v2)
-> Weekly (v2)
ITS-4TFC: 4 Time Frame Confirmation (v1)
ITS-DIV: Divergence Seeker (v1)

EMA/SMA Support/Resistance Levels////////////////////////////////////////////////////////////
// saxonlucius 07/08/2019
// EMA/SMA Major Support/Resistance levels
////////////////////////////////////////////////////////////
The script contains major support/resistance EMA's and SMA's.
This includes:
EMA
EMA 21
EMA 34
EMA 50
EMA 89
EMA 100
EMA 200
EMA 377
SMA
SMA 10
SMA 100
SMA 200
SMA 900
The EMA 34 and SMA 900 are not as relevant as the others.

Alto Basso Swing Pivots + Barry Support Resistance Levels2 indicators, 1 script: swing pivots and Barry support resistance levels
Alto
high swing pivot
Basso
low swing pivot
Dal Segno
lookback period length for swing pivots
Barry Length
length for support resistance calculation
--------------------------------------------------------------------------------------------------------------------------------------------------------------------------------------------
Use swing pivots for confirmation of new structure levels on short term
Barry support resistance levels in proximity to standard pivots or Fibonacci levels may indicate greater strength
credit to BacktestRookies and likebike
stay ♯
Example: Dal Segno 13, Barry Length 21

Vortex indicator cross support&resistance [LM]Hello traders,
I would like you to present Vortex indicator cross support&resistance script. The idea behind is same as my other S/R scripts to look for important S/R levels.
This time I have used little known and not that old Vortex Indicator that has been released in 2010. Vortex indicator has two plots that crosses each other and on the cross line is rendered. I have included smoothing with TEMA.
The indicator has following settings:
General control - here you can select period of vortex indicator and show/hide labels
Line control - where you can select type of line, colors...
Hope you will enjoy it,
Lukas
session min/max support&resistance [LM]Hello traders,
I would like to present you session min/max support&resistance indicator. The idea behind is to calculate min and max per session and render line at those levels and bars until the price reach the level. With this you can see levels where the price didn't reach with granular control over how many lines can be shown.
Indicator has following settings:
General control - where you can select session interval and show/hide labels
Line control - where you can adjust type of line, color of up/bottom level..
I hope you will enjoy it,
Lukas

Compression support&resistance [LM]Hello traders,
I would like to present you Compression support&resistance script. The idea behind is to look for areas of price compression(inside bar candles). Basically the S/R lines are created after three candles that are formed in certain pattern and volume conditions. First candle of pattern is usually the most volatile and fist inside bar after volatile candle high and low creates S/R lines in order to look for breakouts or for future bounces of the S/R line. Also by default volume has to be decreasing from candle to candle, although this condition can be controlled by setting.
It has various settings as my other S/R scripts for multi timeframe analysis. The current timeframe uses line API but for multi timeframe I use plot lines. There are two filters. Volume filter for declining volume of the pattern candles and volatility filter which renders line only in case that pattern occurs after some % change has happened within some lookback period.
Credit also for this indicator goes to @berkek as he took time to explain it to me.
Hope you will enjoy it,
Lukas
Auto Support ResistanceAn indicator that draws support, resistance and trend lines automatically based on the high/low and current direction of the asset.

Quaterly & Monthly & Weekly & Daily Support&Resistance [LM]Hello traders,
I would like to introduce you Quaterly & Monthly & Weekly & Daily Support&Resistance study. The idea behind it is to look for natural S/R levels based on high/low of higher time and looking for ranges. Script has 4 different high&lows levels that you can configure at your will what is shon and how.
You can combine various timeframe ranges to look for bounces
I hope you will enjoy it.

donchain support&resistance levels [LM]Hello Traders,
I would like to introduce you donchain support&resistance levels. The idea is to look for important levels that are identified by donchain line, where donchain usualy spents a lot of time without any move usualy turns out to be good level for bounces.
Also note that when there is a big spread between first line and second line it usually leads to some pullback.
Here you have an example of big spread:
You are also able to show donchain lines and not only horizontals this you can find in settings:
Enjoy!

SW Support / Resistance System plus EMA cross alerts//=====================================================================
//SW Support / Resistance System plus EMA cross alerts
//(Some parts belong to ChrisMoody)
// June 23rd, 2019
//=====================================================================


Ersoy Support-Resistance-Osilatorwebsite: www.ersoytoptas.com
Newspaper : tr.investing.com
Hi this is a oscillator ...
Close Support , Remote Support , Resistance and works with the live screen.

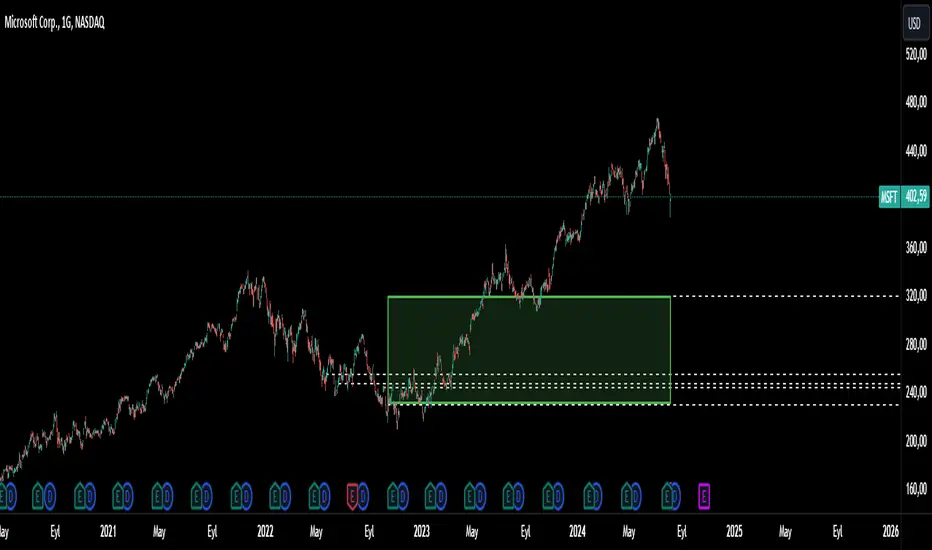
Support ResistanceThis indicator was written in pine script code, inspired by the L3 Banker Fund Flow Trend Oscillator indicator whose link I gave below.
This indicator is designed to track the flow of banker funds in the market by analyzing price movements and generating entry signals based on specific criteria. It uses a combination of custom functions and moving averages to identify potential points where bankers might be entering the market.
Key Features:
Fund Flow Trend Calculation:
The indicator calculates the fund flow trend using a combination of weighted moving averages. This helps in identifying the overall trend and potential reversals.
Bull Bear Line:
A key component of the indicator is the Bull Bear Line, which is derived from the typical price, lowest low, and highest high over a specified period. This line helps in determining the strength and direction of the market trend.
Banker Entry Signal:
The indicator generates a banker entry signal when the fund flow trend crosses above the Bull Bear Line, and the Bull Bear Line is below 25. This condition is indicative of a potential entry point for bankers.
Visual Representation:
Entry prices and indices for the last five banker entry signals are stored and used to draw dashed lines on the chart, representing these significant levels.
A dynamic rectangle is drawn between the last two entry prices, which extends to the right until the specified conditions are met. The rectangle's color changes from red to green if the price crosses above it by at least one bar, indicating a potential support zone.
Usage:
Trend Identification:
Use the fund flow trend and Bull Bear Line to identify the prevailing market trend and potential reversal points.
Entry Signals:
Pay attention to the banker entry signals as potential points of entry based on institutional fund flow.
Support and Resistance:
The dynamic rectangle can act as a support zone. Monitor price action relative to this rectangle for potential trading opportunities.
This indicator is a powerful tool for traders looking to align their trades with the movements of large institutional players. By understanding and tracking the flow of banker funds, traders can gain valuable insights into market dynamics and make more informed trading decisions.